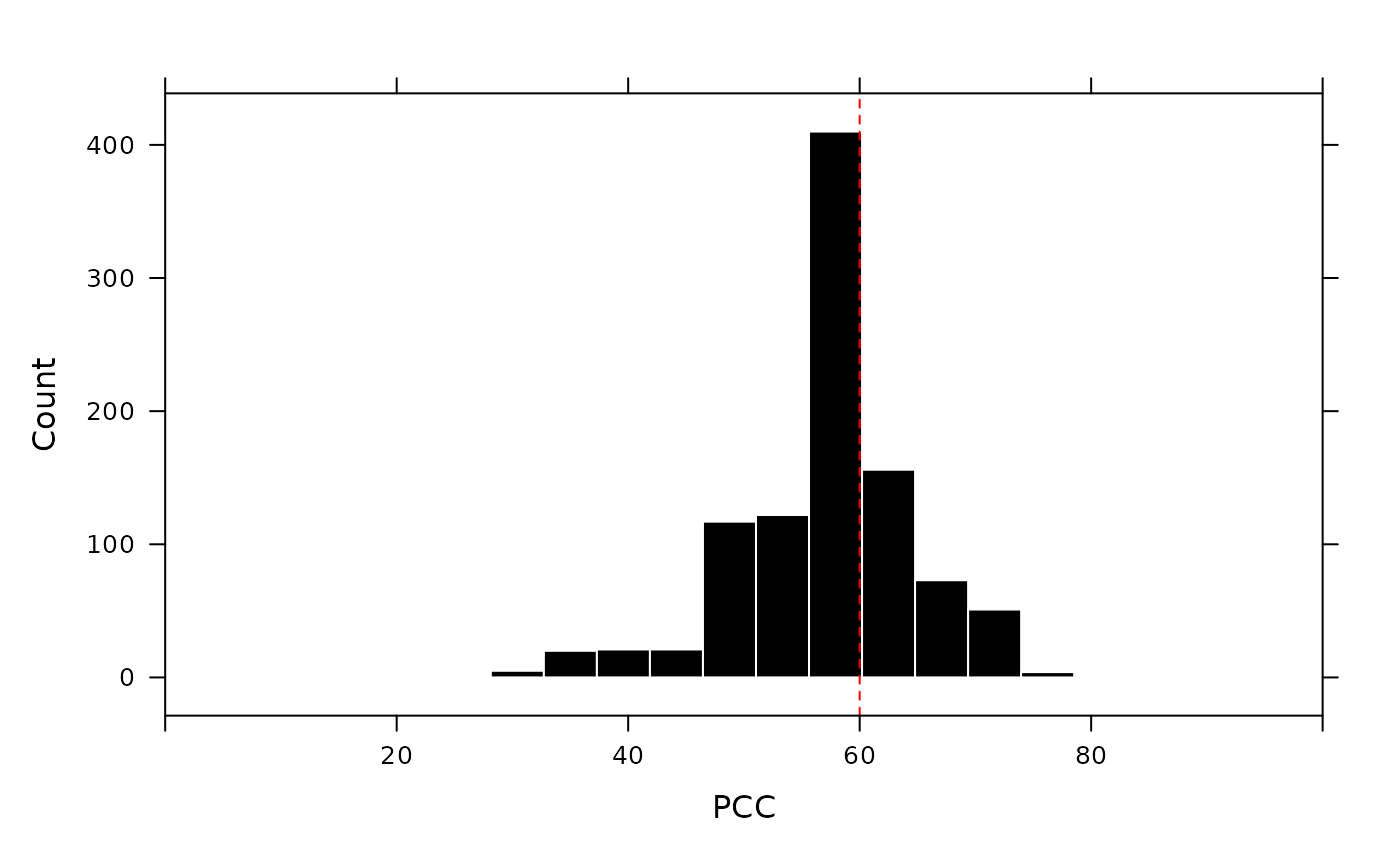
Plot PCC replicates.
Usage
# S3 method for class 'clubprorand'
plot(x, ...)
Arguments
- x
an object of class "clubprofit" produced by
club()- ...
ignored
Details
Plot the distribution of PCCs computed from randomly reordered data used to calculate the chance-value.
Examples
mod <- club(rate ~ dose, data = caffeine)
plot(pcc_replicates(mod))
