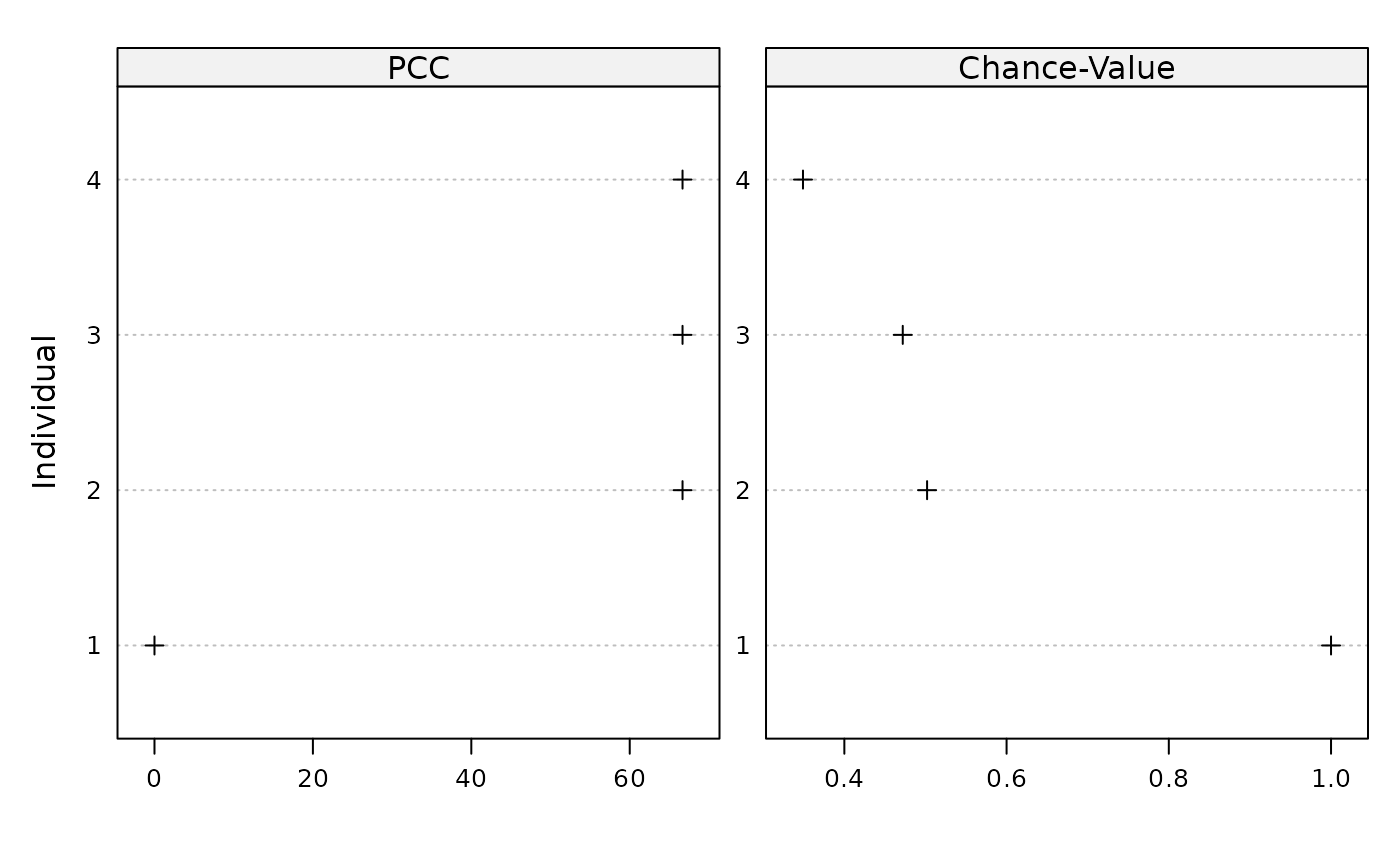
Plots individual-level PCCs and chance-values.
Usage
# S3 method for class 'opafit'
plot(x, ...)
Arguments
- x
an object of class "opafit" produced by
opa()- ...
ignored
Examples
dat <- data.frame(t1 = c(9, 4, 8, 10),
                  t2 = c(8, 8, 12, 10),
                  t3 = c(8, 5, 10, 11))
h <- hypothesis(1:3)
opamod <- opa(dat, h)
plot(opamod)